SOLISCADA V7.70.00.01 is now available. Important Notice: License Key reactivation is required after updating. Learn what's new and update now→
 SOLISCADA at a Glance
 Architecture
 Why Choose Us
 Essential Functionalities
 Beyond the Basics
 System Recommendations
 FAQs
FAQs Oil & Gas
 Water Industry
 Food & Pharmaceuticals
 Marine
 Mining & Metal
 Manufacturing
 Electric Utilities
 Municipal Industry
In industrial automation projects, real-time monitoring of communication status for field devices (such as PLCs and gateways) is essential. Timely detection of offline devices helps quickly identify network or hardware issues, ensuring stable production operations. This article provides a detailed guide on how to use the NodeSniffer driver in SOLISCADA to efficiently determine device online/offline status and dynamically count the number of online and offline devices.
1. Core Principle: Introduction to the NodeSniffer Driver
The NodeSniffer driver is a lightweight driver specifically designed for network diagnostics. Its core function is to send probe requests to specified device IP addresses through the TCP/IP protocol and determine the device's network connection status based on the response results.
Working Principle: The driver periodically attempts to establish a TCP connection with the target IP address.
Status Mapping: When the connection is successful, the corresponding tag value of the driver is 1 (ON / TRUE), indicating that the device is online.
When the connection fails, the corresponding tag value is 0 (OFF / FALSE), indicating that the device is offline.
2. Core Principle: Configuration Steps: From Setup to Display
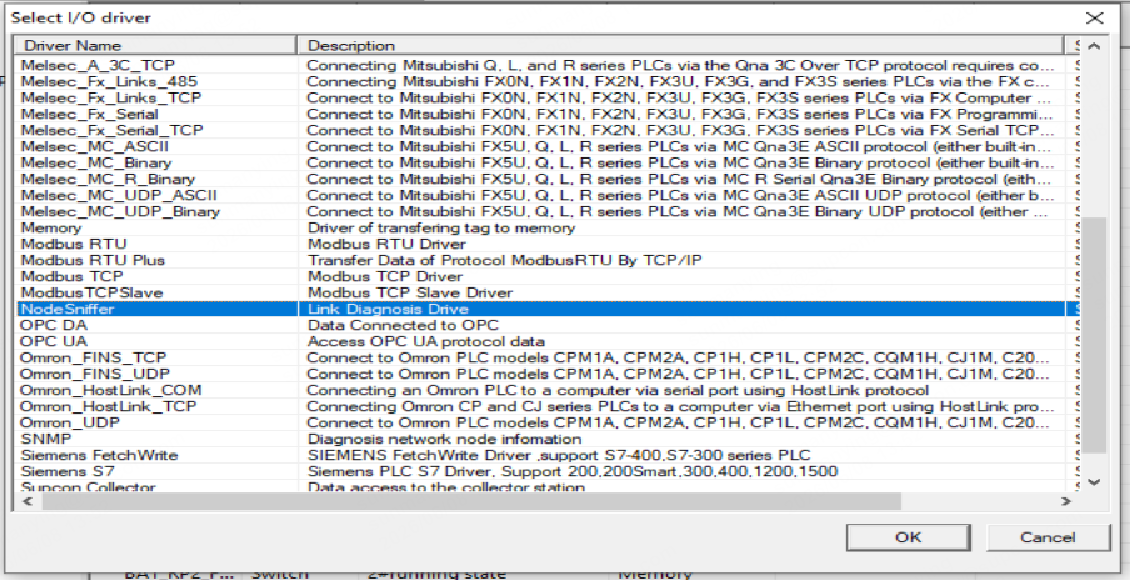
Step1:Add the NodeSniffer Driver and Diagnostic Tags
Add the Driver: In the SOLISCADA configuration software’s I/O Driver Management interface, add the “NodeSniffer” driver.
Create Device Diagnostic Tags: Under the NodeSniffer driver, create a corresponding tag for each network device that needs to be monitored.
Tag Type: It is recommended to configure the tag as a Boolean (BOOL) or Integer type (0 and 1) to simplify later statistics of online device quantities.
Configure I/O Address: In the tag's I/O Address Configuration dialog box, directly enter the target device's IP address (for example, 192.168.56.151). This address will be used by the driver as the target for network probing.
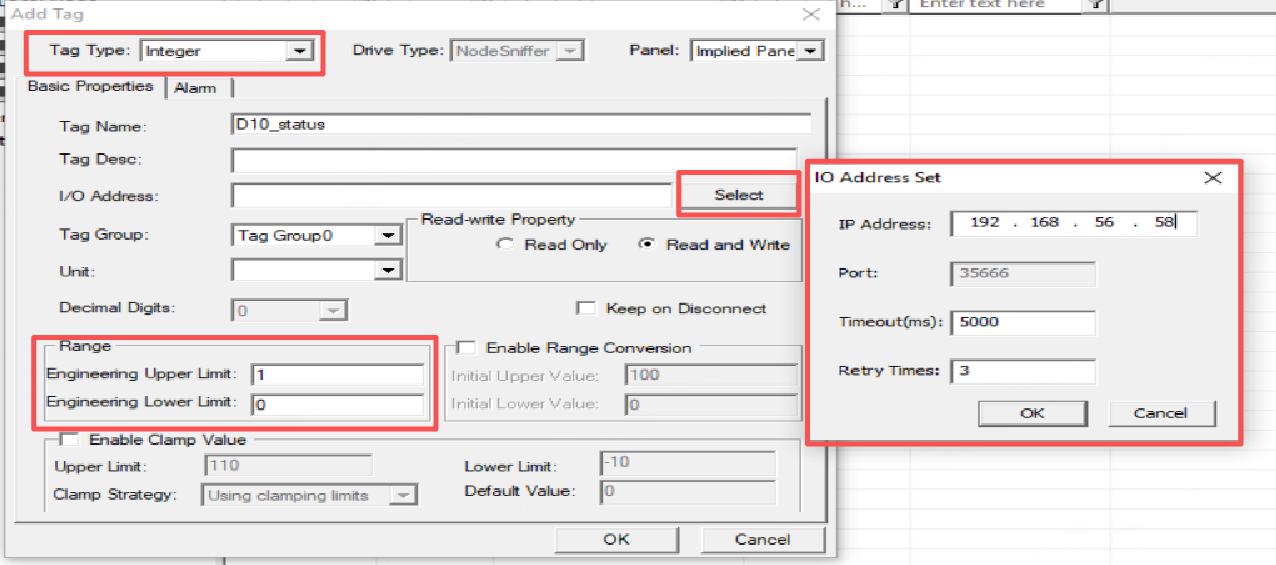
After completing the configuration, the real-time value of the tag will directly reflect the online status of the device corresponding to the specified IP address.
Step 2: Visualize Device Status in the Process Screen
To make monitoring easier for operators, the diagnostic tags created above can be linked to graphical controls in the process screen:
Use graphical elements such as indicator lights or filled rectangles, and associate their color or status with the diagnostic tags.
For example, configure the rules so that green is displayed when the tag value is 1 (Online), and red is displayed when the value is 0 (Offline).
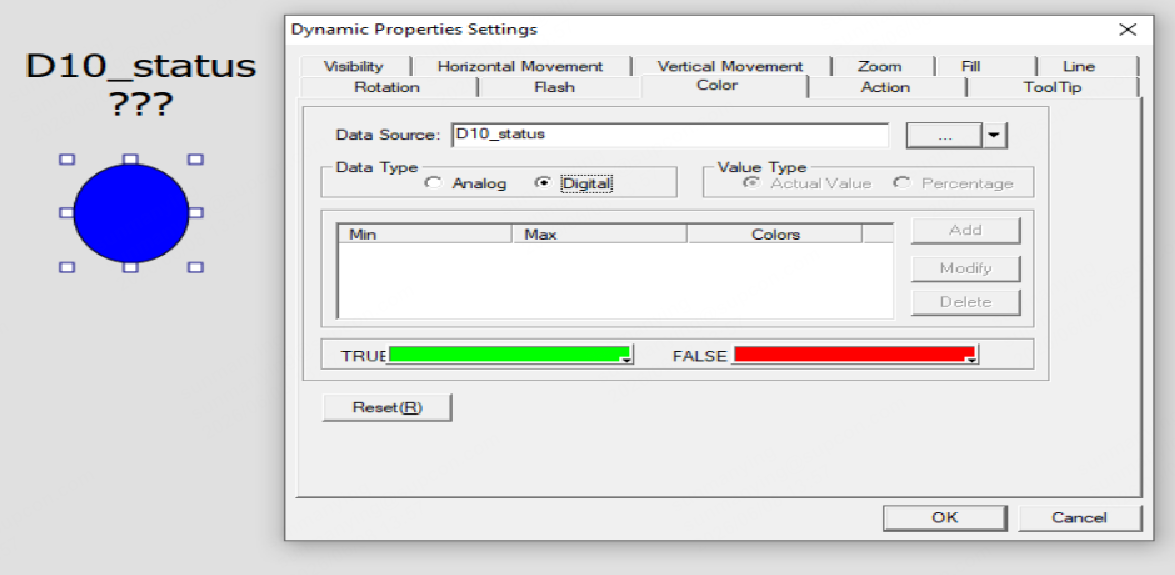
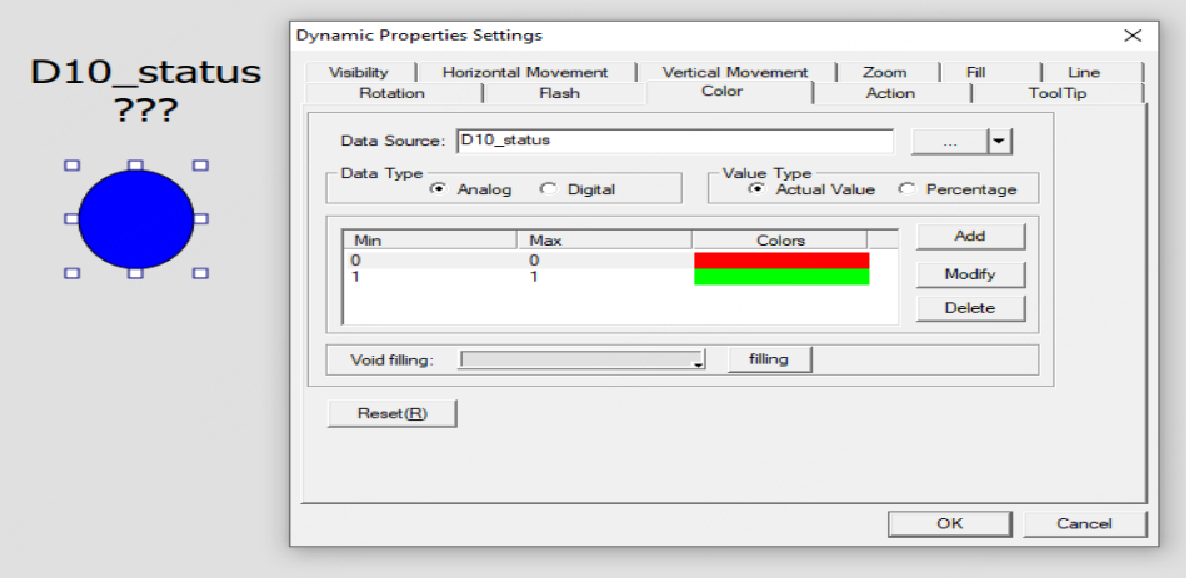
This allows the overall health status of the device network to be monitored at a glance.
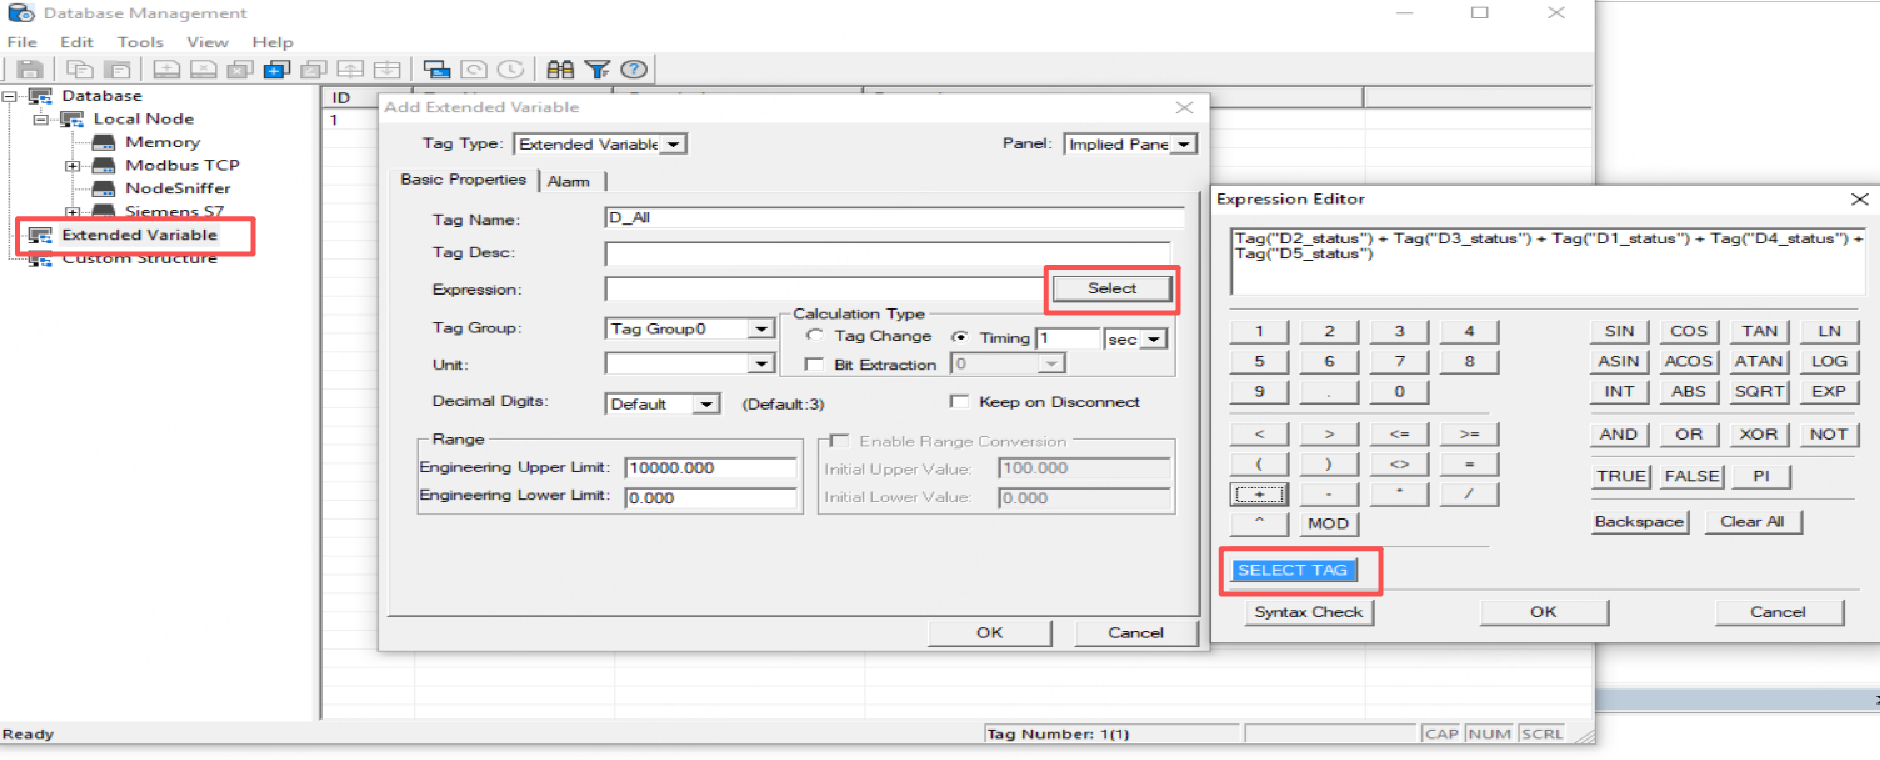
3. Counting Online/Offline Devices
Create an Online Device Count Tag: Under Calculated Variables, add a tag to calculate the number of online devices.
Tag Type: Calculated Variable.
Configure I/O Address: In the tag’s I/O Address Configuration dialog box, reference the diagnostic tags using Tag("Tag Name"). For example: Tag("D1_status") + Tag("D2_status") + Tag("D3_status")
Note: The diagnostic tags should be configured as Integer type tags.
Finally, create a Label Display Control in the process screen and bind it to the variable that stores the online device count. This completes a real-time dashboard for monitoring the number of online devices.